
Shrimp,
does it really help with Whether shrimp worsens blood lipids in normolipidemic adults?
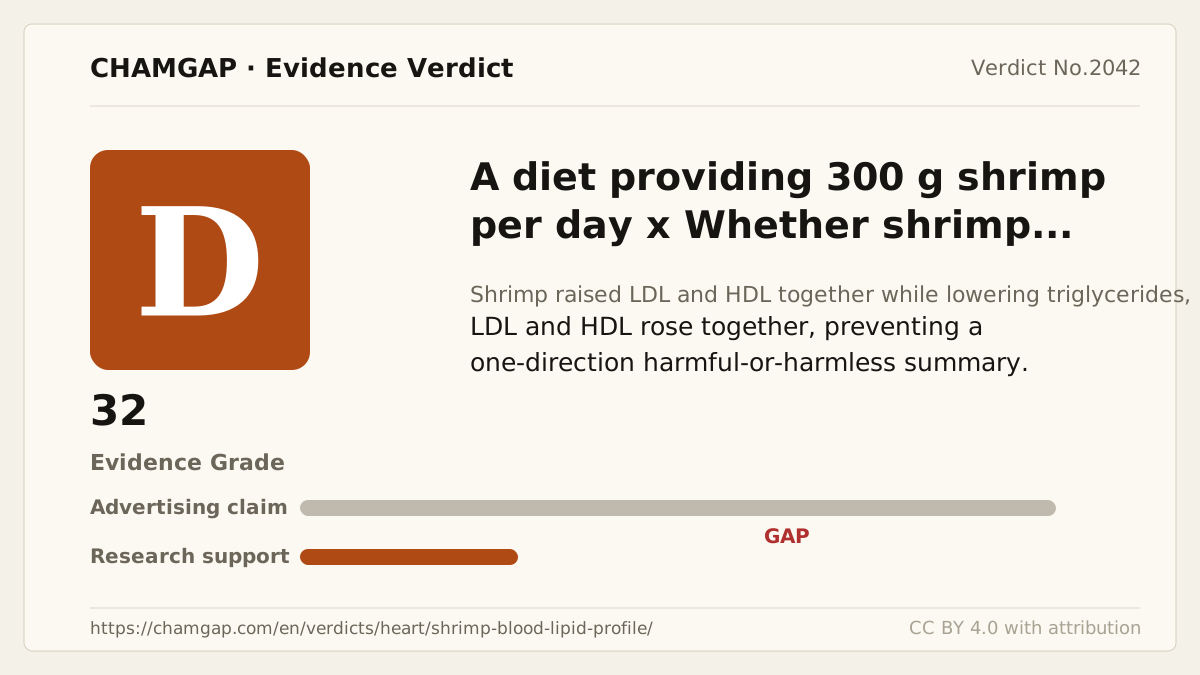
research showsThe grade is D with 30 points. In an 18-person randomized crossover feeding trial with three weeks per diet, shrimp raised LDL 7.1%, raised HDL 12.1%, and lowered triglycerides 13%. Total-cholesterol/HDL and LDL/HDL ratios did not worsen. The claim that shrimp worsens lipids was not supported in this trial.
ads claimHigh dietary cholesterol in the shrimp diet is a measured fact, but blood lipids did not all move in one direction. Verdict 010 is C with no recorded score for an omega-3 capsule circulation claim; this verdict concerns whole shrimp feeding.
Useful facts when choosing a product
- The shrimp diet supplied 300 g/day and 590 mg/day dietary cholesterol. Species, farmed status, and fresh or frozen state were not clear in accessible reporting.
- Accessible reporting confirms shrimp feeding but did not establish a precise cooking method.
- The FDA monitoring-table mean for total mercury in shrimp is 0.009 ppm, not a direct methylmercury analysis of the trial shrimp.
- LDL rose 7.1%, HDL rose 12.1%, and triglycerides fell 13%.
Chamgap Semantic Classification Code
Candidate index · review held
D.diet-providing-shrimp.dietary.whether-shrimp-worsens-blood-lipids-in-normolipidemic-adults.assess.UNKDietary patterns and eating practices > diet providing shrimp > Dietary regimen > Whether shrimp worsens blood lipids in normolipidemic adults > Association or change assessment > Unknown
An automated migration candidate, not an issued permanent code; exact claim scope remains under review. This machine-generated migration candidate helps retrieval but is not a permanent assignment. The original verdict ID and URL remain authoritative.
What the research actually shows
Eighteen normolipidemic adults consumed low-fat baseline, shrimp, and egg diets in randomized sequence for three weeks each. Shrimp supplied 300 g/day and 590 mg/day dietary cholesterol versus 107 mg/day in baseline. The 1996 trial predated routine registration. An exact grant number was not verified in publicly accessible material.
Why this is classified as D (30)
No overall lipid-ratio worsening signal appeared, but one 18-person three-week trial without between-group confidence intervals gives D with 30 points.
Counterpoint. The verdict preserves both the LDL increase and the favorable HDL, triglyceride, and ratio findings.
Rejudgment record. Cross-check applied — LDL, HDL, and triglyceride directions were checked separately in the original report and food cholesterol was separated from blood response
| Endpoint | S | Surrogate marker - laboratory or imaging measures |
| Replication | R1 | Single confirmatory trial |
| Independence | I2 | Decisive evidence is publicly or non-profit funded |
| Effect size | E0 | Null |
| Precision | CX | No pooled confidence interval could be confirmed |
Stored derived and displayed grades match; this is not a current recalculation or validity check (D).
Sub-claim grades by effect
This ingredient is marketed for several effects. A single overall grade blends strong and weak claims together, so each effect is graded separately here. The overall grade reflects the strongest disconfirming or core claim.
| Effect (sub-claim) | Grade | Basis |
|---|---|---|
| Shrimp raises LDL | C | LDL rose 7.1% during the three-week feeding period. |
| Shrimp worsens the overall lipid profile | C | Concurrent HDL increase and triglyceride reduction prevent that conclusion. |
Cross-check — AI research and Codex final gate
Evidence Table
| Study | Design | Sample | Funding | Endpoint | Result | Weight |
|---|---|---|---|---|---|---|
| De Oliveira e Silva ER et al. 1996 | Randomized controlled crossover feeding trial | 18 normolipidemic adults | Exact grant number not verified in publicly accessible reporting | LDL, HDL, triglycerides, and lipoprotein ratios | Versus baseline: LDL +7.1%, P=.014; HDL +12.1%, P=.0001; triglycerides -13%, P=.004; lipoprotein ratios did not worsen | Direct feeding evidence limited by very small sample, short duration, and surrogate outcomes |
Receipt — 2 References
All 2 cited sources were verified for existence at the original page (as of 2026-08-03).
Final verification and publication gate: Codex · Evidence date: 2026-08-03 · Corrections: none
Cite this verdict
[Chamgap] Shrimp x worsening of the blood-lipid profile — Evidence Grade D·30. 2 cited sources checked. Source: https://chamgap.com/en/verdicts/heart/shrimp-blood-lipid-profile/ · CC BY 4.0CC BY 4.0 — free to use with attribution; do not distort grades, numbers, or verdict meaning.
What this document does and does not do
Chamgap is an information source. It reports what research has and has not confirmed; it does not tell readers what to take or buy. That decision belongs to readers and, when needed, medical or legal professionals. This verdict reflects literature available up to the search date and may change as new research appears. Nothing here is medical advice.