
Ultra-processed foods,
does it really help with Increased all-cause mortality?
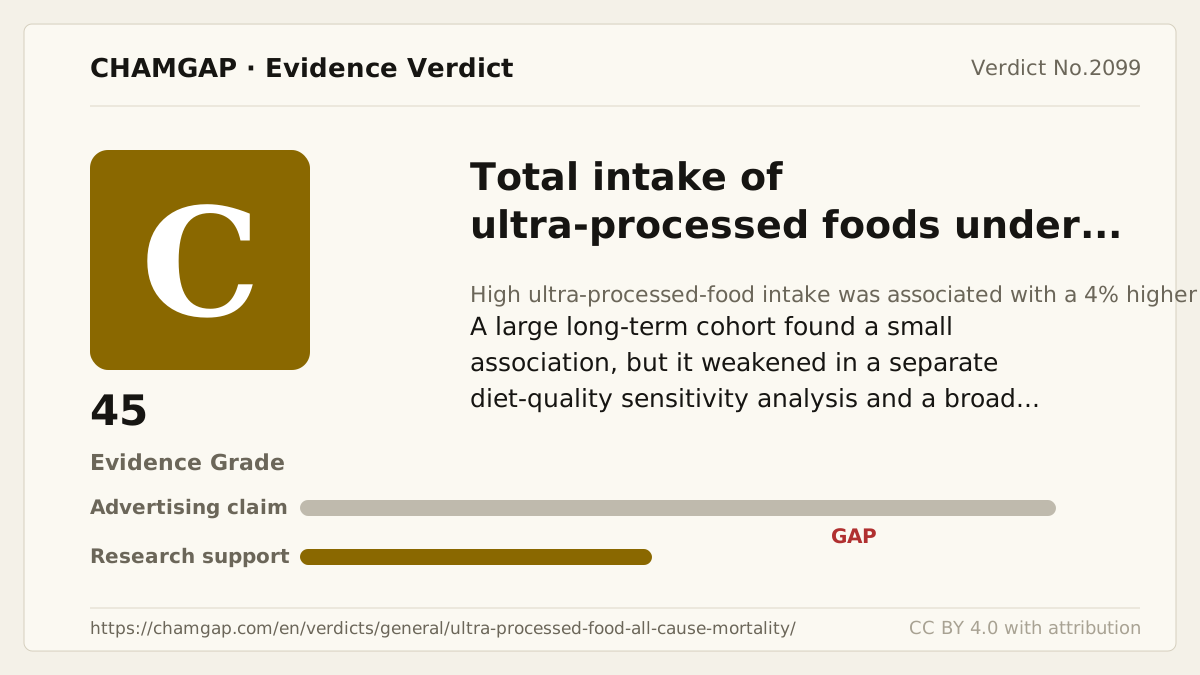
research showsThe grade is C. The NHS and HPFS followed 74,563 women and 39,501 men, 114,064 people total, for up to 34 years and documented 48,193 deaths. The highest quarter, 7.4 servings daily, had a 4% higher all-cause mortality hazard than the lowest, 3.0 servings daily: HR 1.04, 95% CI 1.01 to 1.07. This is a small observational association with actual deaths.
ads claimNOVA generally classifies processing; it does not measure risk magnitude. The exposure actually constructed for this study's primary analysis explicitly excluded ultra-processed whole-grain products because of known whole-grain benefits; adding them back was a sensitivity analysis. How yogurt, soy milk, and canned beans were classified in the primary exposure could not be confirmed.
Useful facts when choosing a product
- Thousands of products were pooled, so no common serving value exists for sodium, sugar, saturated fat, fiber, or protein.
- Median intake was 7.4 versus 3.0 servings daily, and mortality rates were 1,536 versus 1,472 per 100,000 person-years.
- Verdict 2081 is C with 56 points for sugar-sweetened beverages and all-cause mortality; this verdict pools many food groups by NOVA classification.
Chamgap Semantic Classification Code
Candidate index · review held
F.total-intake-of-ultra-processed-foods-under-the-nova-classification.oral.all-cause-mortality.increase.UNKFoods and beverages > Total intake of ultra-processed foods under the NOVA classification > Oral > all-cause mortality > Increase claim > Unknown
An automated migration candidate, not an issued permanent code; exact claim scope remains under review. This machine-generated migration candidate helps retrieval but is not a permanent assignment. The original verdict ID and URL remain authoritative.
What the research actually shows
Fang and colleagues repeatedly updated diet using semiquantitative food-frequency questionnaires and ascertained deaths through national records. Models adjusted for smoking intensity, activity, alcohol, BMI, calories, education, and overall diet quality, but income and other product-choice factors may leave residual confounding, and many causes, subgroups, and models were analyzed. No direct validity coefficient for total NOVA-classified intake was reported. NIH public funding was verified.
Why this is classified as C (56)
A publicly funded large cohort found an all-cause mortality HR excluding 1, but the small association, residual confounding, and unadjusted multiple analyses give C with 56 points.
Counterpoint. This was not a randomized long-term test separating processing from nutrients, replacement foods, and consumer characteristics.
Rejudgment record. Cross-check applied — Cross-checked the analytic population, deaths, adjusted HR, food-group composition, confounder adjustment, and funding
| Endpoint | H | Hard endpoint - actual events such as death |
| Replication | R1 | Single confirmatory trial |
| Independence | I2 | Decisive evidence is publicly or non-profit funded |
| Effect size | E+ | Meets the clinically important threshold |
Stored derived and displayed grades match; this is not a current recalculation or validity check (C).
Sub-claim grades by effect
This ingredient is marketed for several effects. A single overall grade blends strong and weak claims together, so each effect is graded separately here. The overall grade reflects the strongest disconfirming or core claim.
| Effect (sub-claim) | Grade | Basis |
|---|---|---|
| High ultra-processed-food intake and increased all-cause mortality | C | The HR was 1.04 (1.01 to 1.07), a small nonrandomized association. |
Cross-check — AI research and Codex final gate
Evidence Table
| Study | Design | Sample | Funding | Endpoint | Result | Weight |
|---|---|---|---|---|---|---|
| Fang Z et al., 2024 NHS and HPFS | Prospective cohort analysis with repeated dietary assessment | 114,064 participants, up to 34 years, and 48,193 deaths | US NIH public funding | All-cause and cause-specific mortality | Highest versus lowest quarter all-cause mortality HR 1.04 (95% CI 1.01 to 1.07) | Large hard-outcome evidence, but observational dietary exposure |
Receipt — 1 References
All 1 cited sources were verified for existence at the original page (as of 2026-08-03).
Final verification and publication gate: Codex · Evidence date: 2026-08-03 · Corrections: none
Cite this verdict
[Chamgap] Ultra-processed foods x increased all-cause mortality — Evidence Grade C·56. 1 cited sources checked. Source: https://chamgap.com/en/verdicts/general/ultra-processed-food-all-cause-mortality/ · CC BY 4.0CC BY 4.0 — free to use with attribution; do not distort grades, numbers, or verdict meaning.
What this document does and does not do
Chamgap is an information source. It reports what research has and has not confirmed; it does not tell readers what to take or buy. That decision belongs to readers and, when needed, medical or legal professionals. This verdict reflects literature available up to the search date and may change as new research appears. Nothing here is medical advice.