
Sugar-sweetened beverages,
does it really help with Increased all-cause mortality?
research showsThe grade is C. In 80,647 women from the NHS and 37,716 men from the HPFS, people consuming at least two servings per day had a 21% higher all-cause mortality hazard than those consuming less than one serving per month, HR 1.21, 95% CI 1.13 to 1.28. Beverages were observed rather than assigned, so this does not establish a causal mortality effect.
ads claimGranulated sugar being almost entirely sucrose and providing calories is a composition fact. A causal mortality effect of sugary drinks is a separate health claim. An observational association cannot be rewritten as proof that one can shortens an individual's life.
Useful facts when choosing a product
- USDA FoodData Central reports about 99.8 g sucrose and 387 kcal per 100 g of granulated sugar. Digestion of sucrose yields nearly equal molar amounts of glucose and fructose.
- International GI tables commonly report a sucrose GI near 65. GI is a relative acute glycemic-response measure, not a measurement of long-term mortality.
- The Malik study combined carbonated sugary drinks and fruit drinks in 355-mL serving-frequency categories. Sugar per bottle cannot be fixed without the specific product label.
- Verdict 1449 is D with 29 points for extra-virgin olive oil and all-cause mortality; this verdict concerns observed intake of added-sugar beverages and uses a different exposure and design. Verdict 2019 is C with 56 points for wholegrains and the same mortality endpoint.
Chamgap Semantic Classification Code
Candidate index · review held
F.sugar-sweetened-beverages-such.food.all-cause-mortality.increase.UNKFoods and beverages > Sugar-sweetened beverages such > Food consumption > all-cause mortality > Increase claim > Unknown
An automated migration candidate, not an issued permanent code; exact claim scope remains under review. This machine-generated migration candidate helps retrieval but is not a permanent assignment. The original verdict ID and URL remain authoritative.
What the research actually shows
Malik and colleagues followed 80,647 NHS women and 37,716 HPFS men, 118,363 people in total, for 3,415,564 person-years and documented 36,436 deaths. One serving was 12 oz, about 355 mL. The all-cause mortality HR was 1.21 (1.13 to 1.28), and cardiovascular mortality HR was 1.31 (1.15 to 1.50), for at least two servings per day versus less than one per month. In related NHS and HPFS validation work, food-frequency questionnaire correlations against diet records were about 0.84 for cola, 0.73 for low-calorie cola, and 0.75 to 0.89 for fruit juices. Self-report error still remains, and NHS and HPFS were analyzed by the same research network in one paper, so they were not counted as independent replication. NIH public funding was verified.
Why this is classified as C (56)
A publicly funded large cohort found an all-cause mortality association whose interval excluded 1, but self-reported diet, multiple analyses, and residual confounding yield C with 56 points.
Counterpoint. Replacing sugary drinks with water differs from adding them to an existing diet. This exposure analysis cannot estimate every specific substitution.
Rejudgment record. Cross-check applied — Assessed death ascertainment, repeated dietary measures, adjusted hazard ratios, exposure misclassification, residual confounding, and multiple analyses
| Endpoint | H | Hard endpoint - actual events such as death |
| Replication | R1 | Single confirmatory trial |
| Independence | I2 | Decisive evidence is publicly or non-profit funded |
| Effect size | E+ | Meets the clinically important threshold |
Stored derived and displayed grades match; this is not a current recalculation or validity check (C).
Sub-claim grades by effect
This ingredient is marketed for several effects. A single overall grade blends strong and weak claims together, so each effect is graded separately here. The overall grade reflects the strongest disconfirming or core claim.
| Effect (sub-claim) | Grade | Basis |
|---|---|---|
| High sugar-sweetened beverage intake and increased all-cause mortality | C | The HR was 1.21 (1.13 to 1.28), but the evidence was observational and nonrandomized. |
Cross-check — AI research and Codex final gate
Evidence Table
| Study | Design | Sample | Funding | Endpoint | Result | Weight |
|---|---|---|---|---|---|---|
| Malik VS et al., 2019 NHS and HPFS | Prospective cohort analysis with repeated dietary assessment | 118,363 participants, 3,415,564 person-years, and 36,436 deaths | US NIH public funding | All-cause and cause-specific mortality | At least two servings per day versus less than one per month: all-cause mortality HR 1.21 (95% CI 1.13 to 1.28); cardiovascular mortality HR 1.31 (1.15 to 1.50) | Large hard-outcome evidence, but observational and nonrandomized |
Receipt — 4 References
All 4 cited sources were verified for existence at the original page (as of 2026-08-03).
Final verification and publication gate: Codex · Evidence date: 2026-08-03 · Corrections: none
Cite this verdict
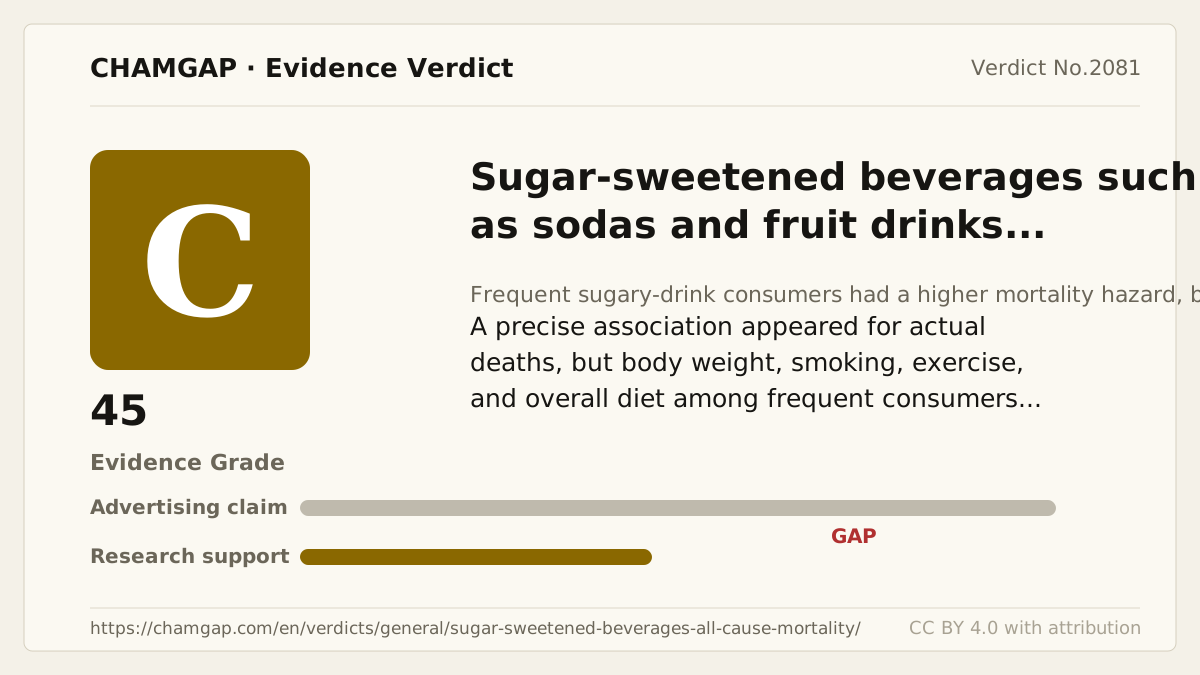
[Chamgap] Sugar-sweetened beverages x increased all-cause mortality — Evidence Grade C·56. 4 cited sources checked. Source: https://chamgap.com/en/verdicts/general/sugar-sweetened-beverages-all-cause-mortality/ · CC BY 4.0CC BY 4.0 — free to use with attribution; do not distort grades, numbers, or verdict meaning.
What this document does and does not do
Chamgap is an information source. It reports what research has and has not confirmed; it does not tell readers what to take or buy. That decision belongs to readers and, when needed, medical or legal professionals. This verdict reflects literature available up to the search date and may change as new research appears. Nothing here is medical advice.