
Long-term PM2.5 exposure,
does it really help with Higher all-cause mortality?
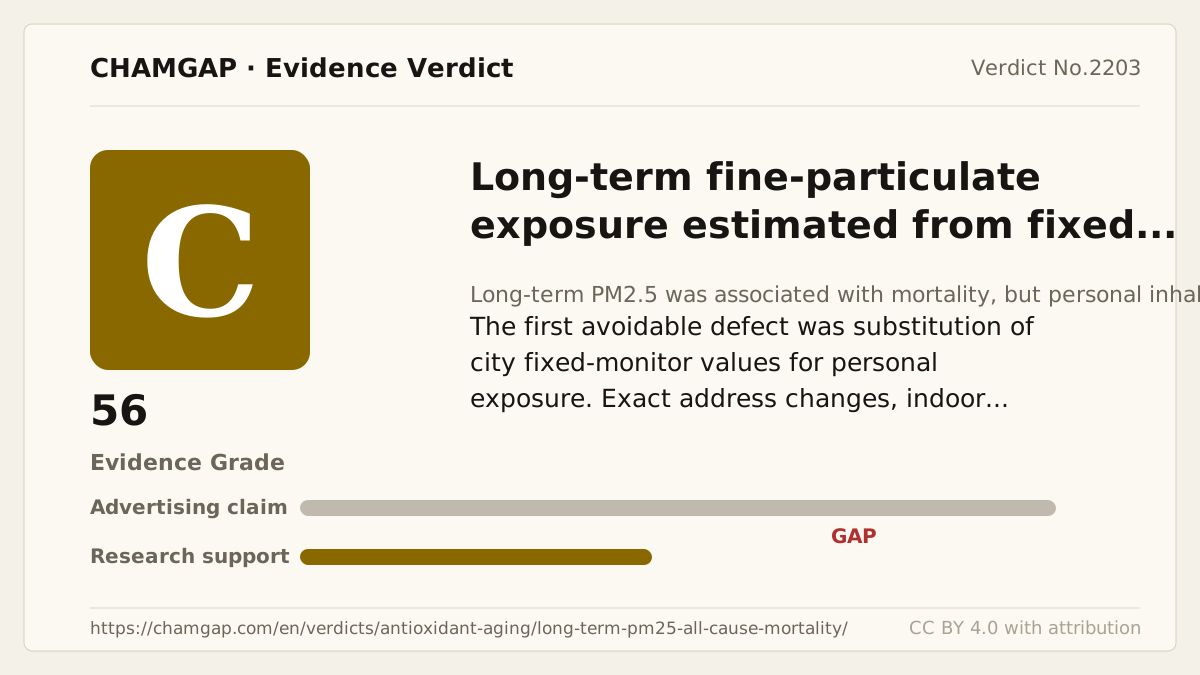
research showsThe grade is C with 56 points. The Harvard Six Cities cohort followed 8,096 people from 1974 through 2009 and recorded 4,495 deaths. The all-cause mortality rate ratio was 1.14 (95% CI 1.07 to 1.22) per 10 micrograms/m3. NIH-AARP was much weaker at 1.03 (1.00 to 1.05) for the same unit, some time-varying results included one, and cardiovascular mortality was 1.10 (1.05 to 1.15). The grade reflects evidence strength, not danger magnitude.
ads claimAn area-level long-term mortality association does not prove that any specific purifier or respirator reverses the same percentage of risk. Personal exposure reduction by the product requires separate evidence.
Useful facts when choosing a product
- After 2001, mean PM2.5 in all six cities was below 18 micrograms/m3; the long follow-up included a broad city-level concentration range.
- Exposure came from fixed monitors and modeled missing years, not personal monitoring.
- There were 4,495 deaths among 8,096 participants followed from 1974 through 2009.
Chamgap Semantic Classification Code
Candidate index · review held
X.long-term-fine-particulate-exposure-estimated-from-fixed-monitoring-networks.environmental.higher-all-cause-mortality.increase.UNKBehaviors, exposures and policies > Long-term fine-particulate exposure estimated from fixed monitoring networks > Environmental exposure > Higher all-cause mortality > Increase claim > Unknown
An automated migration candidate, not an issued permanent code; exact claim scope remains under review. This machine-generated migration candidate helps retrieval but is not a permanent assignment. The original verdict ID and URL remain authoritative.
What the research actually shows
Six Cities assigned city-level study and EPA fixed-monitor data, with estimates for missing years, to residents; no personal monitor was used. Updating exposure for exact residential moves was not verified, and indoor exposure was not measured. Smoking, pack-years, education, and other covariates included participant reports. Models adjusted for age, sex, smoking, education, and BMI, but residual confounding from income, occupation, population density, indoor concentration, commuting, and filtration remained. The concentration-response was reported as linear down to about 8 micrograms/m3. No separate exclusion of deaths in the first several follow-up years was identified in the public article. Funding came from the US EPA and NIEHS, and the authors reported no competing interests.
Why this is classified as C (56)
Thirty-five years of direct deaths and an association extending to low concentrations are strong, but overlapping exposure and confounding defects give C with 56 points.
Counterpoint. C does not quantify an individual's exact risk or prove any product's preventive effect.
Rejudgment record. Cross-check applied — Accepted direct deaths and the association extending to low concentrations while accounting for absent personal and indoor measurement, unmodeled moves, self-reported covariates, and residual income, occupation, and density confounding
| Endpoint | H | Hard endpoint - actual events such as death |
| Replication | R1 | Single confirmatory trial |
| Independence | I2 | Decisive evidence is publicly or non-profit funded |
| Effect size | E+ | Meets the clinically important threshold |
Stored derived and displayed grades match; this is not a current recalculation or validity check (C).
Sub-claim grades by effect
This ingredient is marketed for several effects. A single overall grade blends strong and weak claims together, so each effect is graded separately here. The overall grade reflects the strongest disconfirming or core claim.
| Effect (sub-claim) | Grade | Basis |
|---|---|---|
| Higher all-cause mortality | B | The mortality rate ratio was 1.14 per 10 micrograms/m3 of prior-year PM2.5. |
| Higher cardiovascular mortality | B | The three-year-average mortality rate ratio was 1.26 per 10 micrograms/m3. |
Cross-check — AI research and Codex final gate
Evidence Table
| Study | Design | Sample | Funding | Endpoint | Result | Weight |
|---|---|---|---|---|---|---|
| Lepeule J et al. 2012 Harvard Six Cities | Prospective long-term cohort follow-up | 8,096 participants; 1974-2009; 4,495 deaths | US EPA and NIEHS | All-cause, cardiovascular, and lung-cancer mortality | Per 10 micrograms/m3: all-cause 1.14 (1.07-1.22), cardiovascular 1.26 (1.14-1.40), lung cancer 1.37 (1.07-1.75). | Key long-term direct-event evidence |
| Thurston GD et al. 2016 NIH-AARP | Independent large cohort | 517,041 participants; 2000-2009 | US public funding including NIEHS and NCI | All-cause, cardiovascular, and respiratory mortality | Per 10 micrograms/m3: all-cause HR 1.03 (1.00-1.05), cardiovascular HR 1.10 (1.05-1.15). | Supportive evidence with a smaller estimate |
Receipt — 2 References
All 2 cited sources were verified for existence at the original page (as of 2026-08-04).
Final verification and publication gate: Codex · Evidence date: 2026-08-04 · Corrections: none
Cite this verdict
[Chamgap] Long-term PM2.5 exposure x higher all-cause mortality — Evidence Grade C·56. 2 cited sources checked. Source: https://chamgap.com/en/verdicts/antioxidant-aging/long-term-pm25-all-cause-mortality/ · CC BY 4.0CC BY 4.0 — free to use with attribution; do not distort grades, numbers, or verdict meaning.
What this document does and does not do
Chamgap is an information source. It reports what research has and has not confirmed; it does not tell readers what to take or buy. That decision belongs to readers and, when needed, medical or legal professionals. This verdict reflects literature available up to the search date and may change as new research appears. Nothing here is medical advice.