
Adolescent digital-technology use,
does it really help with Association with lower psychological well-being?
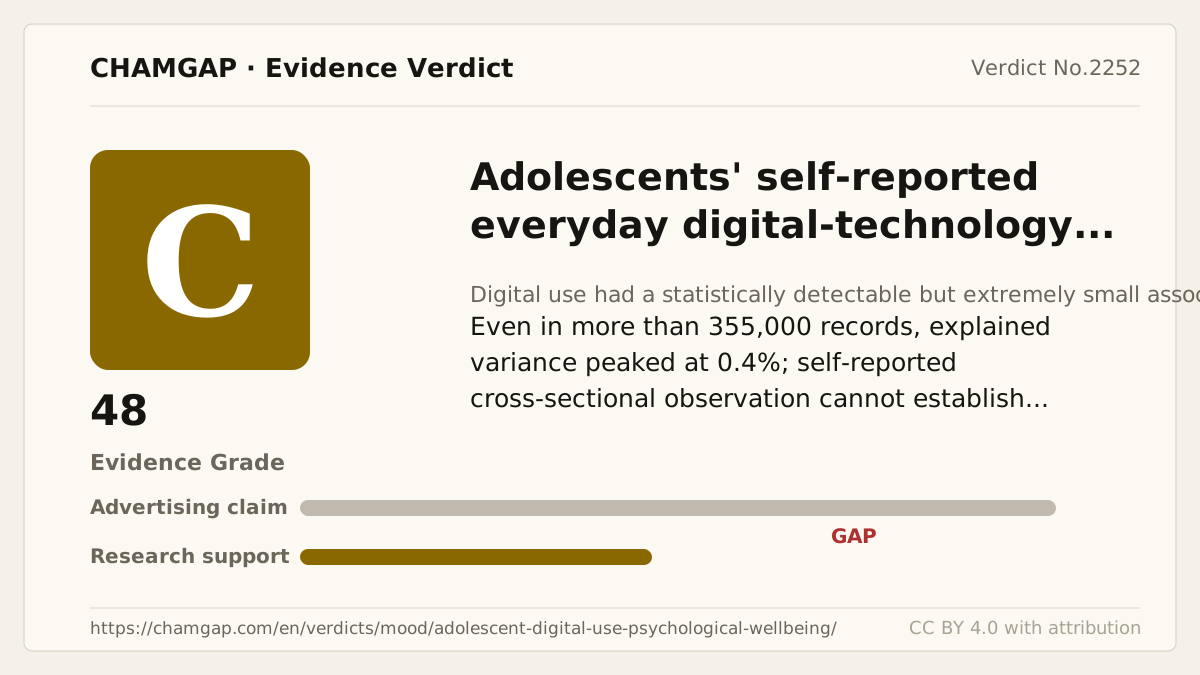
research showsThe grade is C. Across three US and UK adolescent datasets totaling 355,358 people, specification-curve analyses found a negative association, but digital use explained at most 0.4% of well-being variance. That corresponds to a correlation of roughly 0.063 or less, and use was self-reported rather than device-logged. An association exists, but it is tiny and does not establish causation.
ads claimThis study did not identify digital use as a cause of worsening adolescent mental health. Positive associations for sleep and breakfast were up to 44.2 and 30.55 times the magnitude of the negative technology association; potatoes were nearly similar, and glasses were 1.45 times more negative. These are contextual observational comparisons, not causal rankings.
Useful facts when choosing a product
- Digital-use time came from adolescent self-report, not device logs.
- The three datasets totaled 355,358 records, but actual samples varied by questionnaire split and missingness.
- The negative association explained at most 0.4% of well-being variance, equivalent to a correlation of about 0.063 or less.
- The adjusted MCS median beta was -0.005, and self- versus caregiver-reported outcomes differed, indicating possible common-method variance.
Chamgap Semantic Classification Code
Candidate index · review held
UNK.adolescents-self-reported-everyday-digital-technology-use.UNK.association-with-lower-psychological-well-being.reduce.UNKUnknown > Adolescents' self-reported everyday digital-technology use > Unknown > Association with lower psychological well-being > Reduction claim > Unknown
An automated migration candidate, not an issued permanent code; exact claim scope remains under review. This machine-generated migration candidate helps retrieval but is not a permanent assignment. The original verdict ID and URL remain authoritative.
What the research actually shows
YRBS, MTF, and MCS contained 355,358 records in total, while questionnaire splitting and missingness changed the sample for each specification. Maximum explained variance was 0.4%, R-squared 0.004 and |r| about 0.063. In MTF, median beta was 0.001 with controls and -0.013 without; social media alone had median beta -0.031. In MCS, mean use had beta -0.042, self-reported well-being yielded beta -0.046, caregiver-reported well-being was near zero, and the median adjusted specification had beta -0.005. Code was posted on OSF, but a data-naive preregistered analysis was not established. Data collection and author support came from NIDA, CDC, EU Horizon 2020, and UK ESRC public funding. A.O. declared no competing interests; A.K.P. declared no financial interests and disclosed unpaid advisory work for the OECD, Facebook, Google, and ParentZone.
Why this is classified as C (50)
Very large public datasets and specification-curve analysis are strengths, but magnitude was tiny and observational limitations included cross-sectional timing, self-reported exposure, and self-reported outcomes, giving C with 50 points.
Counterpoint. C does not mean a medium level of danger. It means the causal claim is weak despite a small negative association.
Rejudgment record. Cross-check applied — Effect sizes and contextual comparisons across three specification curves, balanced against cross-sectional timing, self-reported exposure, and common-method bias
| Endpoint | P | Symptom or function itself is the target - including patient reports and performance tests |
| Replication | R1 | Single confirmatory trial |
| Independence | I2 | Decisive evidence is publicly or non-profit funded |
| Effect size | E~ | Statistically positive but below the threshold |
Stored derived and displayed grades match; this is not a current recalculation or validity check (C).
Sub-claim grades by effect
This ingredient is marketed for several effects. A single overall grade blends strong and weak claims together, so each effect is graded separately here. The overall grade reflects the strongest disconfirming or core claim.
| Effect (sub-claim) | Grade | Basis |
|---|---|---|
| Observational association between digital use and lower well-being | C | Explained variance was at most 0.4%. |
| Digital use causes lower well-being | ? | The pivotal analyses were cross-sectional regressions without temporal ordering. |
| A large mental-health effect | D | Magnitude was tiny, with maximum |r| about 0.063. |
Cross-check — AI research and Codex final gate
Evidence Table
| Study | Design | Sample | Funding | Endpoint | Result | Weight |
|---|---|---|---|---|---|---|
| Orben and Przybylski 2019 | Large secondary-data observational specification-curve analysis | 355,358 total across YRBS, MTF, and MCS; specification samples varied with questionnaire splitting and missingness | Public funding including NIDA, CDC, EU Horizon 2020, and UK ESRC | Self- or caregiver-reported psychological well-being | Negative association explained at most 0.4%; MCS mean-use beta -0.042 and adjusted median beta -0.005 | Large and transparent about analytic flexibility, but cross-sectional and self-reported |
Receipt — 1 References
All 1 cited sources were verified for existence at the original page (as of 2026-08-05).
Final verification and publication gate: Codex · Evidence date: 2026-08-05 · Corrections: none
Cite this verdict
[Chamgap] Adolescent digital-technology use x lower psychological well-being — Evidence Grade C·50. 1 cited sources checked. Source: https://chamgap.com/en/verdicts/mood/adolescent-digital-use-psychological-wellbeing/ · CC BY 4.0CC BY 4.0 — free to use with attribution; do not distort grades, numbers, or verdict meaning.
What this document does and does not do
Chamgap is an information source. It reports what research has and has not confirmed; it does not tell readers what to take or buy. That decision belongs to readers and, when needed, medical or legal professionals. This verdict reflects literature available up to the search date and may change as new research appears. Nothing here is medical advice.